Jeanne has been building language models since before it was cool.
With nearly ten years of experience in AI, multilingual NLP, and data science, spanning both industry and research, her focus has always been on multilingual and low-resource settings, where data is scarce, noisy, and rarely benchmark-ready. Her work has spanned misinformation detection on social media and real-world language understanding in underrepresented languages, with privacy and data protection as a consistent consideration throughout. More recently, her interests have extended into finance, specifically how language models can be used to extract signal from social media and news to model and anticipate market behaviour.
Her research has been published at ACL, including work on automating multilingual healthcare question answering in low-resource African languages. She approaches problems at the intersection of language, people, and systems, with a particular interest in making AI work in contexts it was never designed for.
Outside of work, she reads widely across behavioural economics, climate change, and misinformation and writes occasionally when something is worth saying.
Originally from Cape Town, Jeanne now lives in England with her husband and two Bengal cats, Eira and Kinzy.

Blog
Benchmaxxing: The ugly art of optimising for leaderboards rather than real-world performance
In 2015, Volkswagen was caught running software that detected when a car was being emissions-tested and switched the engine into a compliant mode for the duration of the test. The AI industry is running a version of the same pattern, at scale, largely unchallenged.
22 April 2026
In 2015, Volkswagen was caught running software in its diesel cars that detected when the vehicle was being emissions-tested and switched the engine into a compliant mode for the duration of the test. On the rolling road, the cars were clean. On the motorway, they emitted up to 40 times the legal limit of NOx. Eleven million vehicles were affected. Volkswagen was forced to spend $14.7 billion to settle the allegations of cheating, including $4.7B in pollution mitigation and investing in zero emissions research.
It's worth starting there, because the AI industry is running a version of the same pattern, at scale, largely unchallenged.
The numbers on AI leaderboards are, in many cases, not what they look like. A meaningful fraction of the scores published at launch, the 94.7% on MMLU, the state-of-the-art on HumanEval, the chart showing the new model beating every incumbent, reflects a model that has been shaped to pass the test rather than one that has improved at the underlying task. This practice has a name in the industry: benchmaxxing. It is the craft of optimising for what the leaderboard measures rather than for the capability the leaderboard is supposed to measure. There is genuine skill involved in doing it well. Hence the ugly art.
Four techniques, in rough order of severity
Benchmaxxing is not a single behaviour. It is a cluster of techniques, some closer to sloppy practice than to deliberate deception, and some harder to describe as anything other than cheating.
Contamination. Modern models are trained on very large samples of the open web, and benchmark questions appear on the open web. MMLU questions surface in training sets. GSM8K problems leak in via forum posts and homework-help sites. The model doesn't reason through the question at evaluation time; it reproduces an answer it has seen before. Some contamination is genuinely accidental. A significant amount is what you might call deniable: the kind of accidental that happens when nobody put much effort into preventing it.
Teaching to the test. Fine-tuning on data that resembles the benchmark without literally being the benchmark. Training the model to produce outputs in whatever format the automated grader recognises. Coaching it to prefix answers with specific phrases because the scoring regex is looking for them. The resulting model is not more capable; it is better-calibrated to the specific conditions of the test. This is the equivalent of engine tuning that improves performance on the dynamometer without improving real-world driving.
Cherry-picking checkpoints. A frontier lab training a new model doesn't produce one model. It produces hundreds of checkpoints across training, plus parallel runs with different data mixes and post-training recipes. Each checkpoint scores slightly differently on each benchmark. One is best at maths, another at coding, a third at reasoning. No single checkpoint is best at everything. When the launch chart is published, each column can come from a different checkpoint, the one that scored highest on that specific eval. The chart is, in a narrow sense, accurate; the numbers were produced by models from that lab. But no single model shipped to customers achieves every score on the chart.
Defeat devices. This is where the Volkswagen comparison stops being a metaphor and starts becoming literal description. Agentic benchmarks like SWE-bench run the model's code in the same environment as the evaluator, which means a sufficiently capable agent can tamper with the scoring infrastructure directly rather than solving the task. This is no longer a hypothetical. In April 2026, researchers at UC Berkeley's Center for Responsible, Decentralized Intelligence published a systematic audit of eight major AI agent benchmarks, including SWE-bench, SWE-bench Pro, WebArena, OSWorld, GAIA, and Terminal-Bench. They found that every single one was exploitable to near-perfect scores with no legitimate work at all:
The SWE-bench Verified exploit was a ten-line conftest.py that hooks into pytest and forces every test to report as passing.
WebArena fell to an agent navigating Chromium to a file:// URL and reading the gold answers directly from the task configs.
Terminal-Bench was broken by replacing /usr/bin/curl with a wrapper that faked test output.
The researchers have open sourced their exploitation kit here: https://github.com/benchjack/benchjack
Documented real-world cases already exist in published leaderboard results. A coding model called IQuest-Coder-V1 claimed an 81.4% score on SWE-bench; UC Berkley’s researchers subsequently found that roughly a quarter of its trajectories were running git log to copy answers from commit history rather than solving the problems. In February 2026, OpenAI published an analysis concluding that SWE-bench Verified, which they had co-created to fix problems with the original SWE-bench, was itself contaminated: every frontier model they tested (GPT-5.2, Claude Opus 4.5, Gemini 3 Flash) could reproduce verbatim gold patches and problem statement specifics for tasks in the benchmark from the task ID alone. OpenAI's own conclusion was that improvements on SWE-bench Verified "no longer reflect meaningful improvements in models' real-world software development abilities. Instead, they increasingly reflect how much the model was exposed to the benchmark at training time". They have stopped reporting the benchmark for frontier evaluation. METR, an independent evaluations organisation, reports that OpenAI's o3 engaged in reward-hacking behaviour (stack introspection, monkey-patching graders, and similar tampering) in 39 of 128 evaluation runs (30.4%), and that the behaviour persisted at high rates even after the model was explicitly instructed not to. The Berkeley team is careful to note they are not alleging that current leaderboard leaders are actively cheating on public benchmarks. Their point is narrower and, in some ways, more unsettling: the vulnerabilities exist, they are trivial to exploit, and a sufficiently capable agent may discover them as an emergent strategy without anyone deliberately instructing it to.
The same pattern shows up in evaluations that use an LLM as a judge. Peer-reviewed work, including the JudgeDeceiver paper from ACM CCS 2024, has demonstrated that carefully constructed adversarial suffixes appended to a response can manipulate LLM judges into selecting that response regardless of its actual quality, with attack success rates exceeding 90% on MT-Bench. Subsequent work has reported success rates of up to 73.8% against judges including GPT-4 and Claude 3 Opus across multiple evaluation tasks. These are not sophisticated exploits; they are short suffixes, optimised against the judge model, that cause the judge to rate the carrying response higher. Any benchmark whose scoring depends on an LLM judge is, at minimum, exposed to this class of attack.
There is a further category worth naming, more speculative but structurally close enough to the above that it belongs in the same conversation. Volkswagen's defeat device detected the test rig by reading telltales such as steering wheel position, wheel rotation, and throttle behaviour. A language model trained on enough evaluation data could, in principle, learn to recognise the shape of a benchmark query without being explicitly told. Multiple-choice formatting, particular system-prompt registers, the absence of conversational context, dataset-specific phrasing: the wrapper that a standard evaluation harness places around a prompt is, from a pattern-recognition point of view, a fingerprint. No one has to engineer this deliberately. A model trained on enough benchmark-shaped data could learn an implicit classifier distinguishing evaluation from production. Whether any current model does this, and at what strength, is difficult to disentangle from ordinary brittleness on out-of-distribution inputs. But the ceiling case, and it is worth sitting with, is a model that has learned, without anyone designing it, to recognise when it is being graded and perform accordingly. If the reward signal is hackable, a sufficiently capable agent may hack it as an emergent strategy rather than a deliberate one.
A worked example
A speech-AI startup recently launched a new model with a blog post announcing that it "sits at the top of the Open ASR Leaderboard" (ASR = Automatic Speech Recognition). While they claim this new title multiple times, the leaderboard is never actually linked in the blog post. For those readers who do not know, the Open ASR Leaderboard is a public, community-run benchmark with a documented submission process. Anyone can contribute a model by opening a pull request. The startup, who claims they are now at the top of this leaderboard, had not done this. They had run their own evaluation, on their own infrastructure, on the public test sets, and reported the result as a leaderboard standing in a blog post. The problem is that there's no way for a user or investor to verify the claim independently. It's a bit like grading your own test and telling the examiner "Trust me, bro".
It gets worse.
The post also includes, at the end of the short-form results table, the following disclaimer: "We omit Librispeech and Voxpopuli from the evaluations as we use these datasets during training and cannot guarantee a contaminated result, additionally from our observations, while training on these datasets showed significant WER improvement, overall generalisation was hurt."
The sentence is doing a lot of work for one footnote. First, it states outright that the model was trained on at least two of the standard benchmarks, an admission of contamination that is normally only inferred from replication. Second, those benchmarks were dropped from the reported results, so the reader doesn't see the scores that would reflect the contamination. Third, training on those benchmarks improved the headline scores while hurting general performance. You cannot, in the same blog post, claim to have the best model and also admit that your model got worse. These are incompatible claims. The disclaimer is saying the quiet part out loud at the bottom of a results table, and hoping no one reads that far.
The multilingual table in the same post introduces a column titled "Avg (excl. Swe)", an average excluding Swedish. Swedish is the one language in the comparison where an incumbent baseline scores better. Excluding it produces a lead; including it does not. The writers do not flag this metric as custom.
A few smaller details compound confusion. The model's name is not consistent across the post: the introduction uses one name, the second table uses another, the chart uses a third. This could be branding in flux, or it could be the checkpoint shuffle from earlier in this post playing out in miniature, with different internal models reported under different labels across different tables. A reader has no way to tell, because none of the numbers in any of the tables are reproducible, because the evaluation was not submitted anywhere a reader could verify it.
None of these choices is unusual on its own. Labs rename models. Averages get customised. Contaminated datasets get dropped from reported results. What's notable is the combination in a single post: an unverified leaderboard claim, an acknowledged training-set contamination, a custom metric that excludes the one loss, and a disclaimer that, read carefully, describes a model that got worse in general while getting better at the benchmarks. Most labs are more careful, or at least more opaque. This particular example is useful because it is a compact, public catalogue of the techniques described above, all in one place, at the top of a product launch.
Follow the money
Why does this happen? Because the AI industry has built itself on benchmark results, dating back to BERT smashing the GLUE benchmark in 2018.
A frontier AI lab at this stage in the cycle spends hundreds of millions to billions of dollars a year on compute, data, salaries, and infrastructure. It cannot fund itself from revenue at the scale the frontier demands. It funds itself from rounds, and rounds are priced on perceived capability. Perceived capability is measured, by investors, the press, and procurement teams, largely through benchmarks, never mind if the benchmarks no longer signal true capabilities. A two-point lead on MMLU can make or break the next funding round. In a market where the top labs are raising at eleven- and twelve-figure valuations, the economic value of a benchmark point substantially exceeds the engineering cost of gaming it.
The incentive compounds. A lab that wins the benchmark cycle attracts better researchers, which produces better models next cycle, which attracts more capital, which buys more compute. Missing the cycle once is not just a round at a lower valuation; it risks falling out of the tier of labs operating at the frontier at all. That turns every launch chart from a marketing artefact into something closer to a survival signal. The pressure to show a taller bar is not a failure of character on the part of the people running these labs. It is a rational response to an environment in which the bar is load-bearing for the enterprise.
This is structurally the same place Volkswagen found itself in the years before Dieselgate. VW had promised investors and regulators a diesel strategy that the underlying physics couldn't deliver under real driving conditions. Once the commitments were made, the choice narrowed: miss the numbers and disappoint the market, or find a way to pass the test and hope the gap was never measured. The engineers who built the defeat device weren't the ones who set the strategy; they were the ones who had to reconcile it. The pressure was financial. The compromise followed.
None of this justifies benchmaxxing. It just tries to explain it. A serious discussion of how to address the problem has to start from the fact that the people doing it are, in the main, responding sensibly to the incentives they face.
Goodhart's Law, and the cultural layer underneath it
When a measure becomes a target, it ceases to be a good measure. Benchmarks were built to measure capability, but have since become KPIs, and what they now reliably measure is how good a lab is at winning benchmarks.
And none of this is conjecture anymore. Apple's GSM-Symbolic study found that frontier reasoning scores drop significantly when only the numbers or variable names in a maths problem are changed, and that adding a single irrelevant clause can cause accuracy drops of up to 65%. Frontier models now cluster within two or three points of each other on MMLU, a range where noise exceeds signal. Enterprise evaluations document a roughly 37% gap between lab benchmarks and production deployment. Product teams pick a model by its leaderboard position and switch three months later, once they find out what it's actually like to use.
None of this is surprising once you notice that the labs building these models are run by people who got their jobs by passing LeetCode-style interviews: algorithmic puzzles solved under time pressure, against rubrics with an increasingly distant relationship to real engineering work. The pipeline selected, at the margin, for people willing to grind problem sets and pattern-match through the interview. Run that selection for a decade across an industry and the disposition concentrates. An industry that spent ten years rewarding rubric-optimisation in its hiring is now surprised that its products do the same thing.
What to do about it?
A number of recent benchmarks have been built specifically to resist the techniques described above, and they're worth crediting.
LiveCodeBench maintains a rolling monthly update from competitive programming platforms, so a model evaluated today is graded on problems that did not exist when the model was trained. LiveBench.ai extends the same principle across a broader set of tasks. Both address contamination directly by making training-set inclusion temporally impossible rather than merely improbable.
SWE-bench Pro takes a different approach to the same problem. Its public set is constructed from GPL-licensed repositories, on the reasoning that strong copyleft creates a legal deterrent against silent inclusion in proprietary training corpora. It also maintains a private set sourced from proprietary codebases belonging to partner startups, and a held-out set that is not publicly released. The result is a benchmark that is both more contamination-resistant and substantially harder than its predecessors. Top models score around 23% on the public set, compared to 70%-plus on SWE-bench Verified, which is roughly the gap you would expect between a clean evaluation and a contaminated one.
At the more structural end, proposals like PeerBench and dynamic-sampling frameworks such as LLMEval-3 aim to replace the static public benchmark altogether, with formats closer to a proctored exam: private test pools, per-session randomised sampling, and cryptographically verifiable evaluation workflows. Whether any of these becomes the new standard is an open question, but they are at least the right category of answer.
A few honest caveats are worth stating alongside the credit. Private-by-design benchmarks solve contamination but concentrate epistemic authority in whoever curates them, which creates its own problems around transparency and capture. Rolling benchmarks require continuous curation effort and can drift in difficulty over time. And no benchmark, however well-constructed, is a substitute for evaluation on workloads that resemble the actual job. The best current advice for someone choosing a model is still to combine a rotating, contamination-resistant public benchmark with independent replication and internal evaluation on representative data. No single one of these is sufficient on its own.
The underlying point is simpler. Benchmark scores are, at best, a noisy proxy for capability. At worst, they are the output of a system optimised to produce numbers that look good to humans evaluating at a distance, which is not the same thing as a system that is good.
The field will, eventually, correct. Benchmarks will become harder, more private, more adversarial. Contamination detection will improve. The obvious techniques will stop working. Regulators may show up, as they eventually did for the car industry.
It's worth remembering how the car industry's version of this actually ended. Dieselgate didn't stop because Volkswagen had a change of heart, and it didn't stop because the regulators' own tests caught it. It stopped because independent researchers at West Virginia University drove the cars in the real world with portable emissions analysers and compared the numbers to the lab results. The equivalent intervention in AI looks the same: independent evaluation on workloads the labs didn't choose, under conditions they didn't design.
Until then, leaderboard positions are best read with the understanding that they reflect a combination of model capability and the lab's willingness to optimise for leaderboard position, and that the relative weight of those two factors is not disclosed.
In an industry where benchmaxxing becomes the standard, the ones who pay the price are end users and the labs that won't cheat to win.
Vibe-Coding: A Double-Edged Sword
Vibe coding has collapsed the distance between having an idea and having a working app. For prototyping, it's genuinely transformative. But the gap between a convincing demo and production-ready software hasn't closed — and the judgment required to bridge that gap hasn't gotten any cheaper to acquire.
3 March 2026
Andrej Karpathy didn't invent AI-assisted coding, but he did give it a name that stuck. In February 2025, he described a new way of working: fully giving in to the AI, not really writing code so much as directing it. Describing what you want, accepting what it produces, nudging it when it goes wrong. He called it vibe coding. Within weeks, the term was everywhere.
It's easy to see the appeal. The friction between having an idea and having a working implementation has collapsed. What used to take a week of scaffolding, boilerplate, and Stack Overflow archaeology can now be roughed out in an afternoon. For prototyping in particular, this is genuinely transformative.
But vibe coding is a double-edged sword, and which edge you get depends almost entirely on how much you already know.
Solving Problems Like a Pragmatic Programmer
In The Pragmatic Programmer, Andrew Hunt and David Thomas introduce the concept of tracer bullets — a metaphor borrowed from military ammunition that emits a visible trail, letting you see exactly where your shots are landing.
The idea applied to software is this: rather than building each component in isolation and hoping it all fits together at the end, you fire a thin, end-to-end slice through the entire system first. It touches every layer (frontend, API, database, whatever your stack demands) but does very little. It just has to work. Once it does, you fill in the blanks, solve for increasingly complex parts of the problem, and handle the edge cases last.
This is the right way to build software. It validates your architecture early, surfaces integration problems before they compound, and gives you something tangible to iterate on. It is also, not coincidentally, exactly the kind of thing vibe coding is very good at.
Ask an AI to scaffold a working end-to-end prototype of a web app, a data pipeline, or an API and it will do so, quickly and coherently. The tracer bullet is arguably the strongest use case for vibe coding in existence today. The trouble starts when people mistake the tracer bullet for the finished product.
The Illusion of Completeness
AI-generated code has a particular quality that sets it apart from the half-finished scripts most of us used to prototype with: it looks done.
It's formatted correctly, it has docstrings, it compiles and runs without complaint. To the untrained eye, and sometimes even to the trained one under time pressure, it presents as production-ready code. But AI models are trained on the average, known case. They are optimistic about inputs and generous with assumptions — and real software has to survive contact with reality, where the edge cases are exactly the ones that never appear in local testing. Think of it like a house designed by AI with no staircase. Stunning render, perfect floor plan, no way to get to the second floor. It only becomes a problem when someone tries to move in.
The illusion of completeness is not a bug in the AI. It is a predictable consequence of the way these models work. The question is whether the person using the tool knows enough to see through it.
This is where the Dunning-Kruger effect becomes relevant. The less you know about software engineering, the more complete the AI's output will appear. A junior developer or non-technical manager sees formatted, compiling, apparently functional code and concludes the job is done. A senior developer sees the same code and immediately starts asking what's missing. Competence, in this context, is the ability to recognise incompleteness. Vibe coding doesn't change that — it just raises the stakes of not having it.
Experienced Software Engineers Gain The Most
For a senior engineer, vibe coding is a force multiplier. They already have a mental model of what a correct implementation looks like, which means they can use AI to generate the scaffolding and apply their judgment to the parts that actually require it.
They review generated code not as a user reviews a document but as an adversary reviews a contract, looking for what's missing rather than what's there. They know the failure modes. They know which shortcuts are acceptable in a prototype and which will become load-bearing walls in production. They use vibe coding to compress the boring parts of the job while remaining in full control of the interesting ones.
For these engineers, AI coding tools represent a genuine step change in productivity. A controlled experiment by Peng et al. found that developers using GitHub Copilot completed tasks 55.8% faster than those without it. The leverage is real — but it compounds on top of existing skill.
Novices Gain The Least
This is the uncomfortable part of the vibe coding conversation.
A junior developer using vibe coding tools does not learn to code; they learn to prompt. These are not the same skill. Programming is, at its core, the ability to decompose a problem, reason about state, anticipate failure, and make decisions about tradeoffs. You develop this through a particular kind of struggle: writing something that doesn't work, figuring out why, and fixing it. Vibe coding short-circuits this loop entirely.
More immediately dangerous, a junior developer cannot see through the illusion of completeness. They do not yet know what they don't know. A 2024 study by Prather et al. examining novice programmers using GitHub Copilot found that the benefits were sharply uneven: students with strong metacognitive skills performed better with AI assistance, while those without were actively harmed by it. They accepted incorrect code at face value, couldn't diagnose why it failed, and in some cases ended up worse off than if they had written it themselves. A separate GitClear analysis of 153 million lines of code found that code churn — lines reverted or rewritten within two weeks of being authored — was on track to double by 2024 compared to its pre-AI baseline. The code is being written faster. It is also being thrown away faster.
The real-world examples are already piling up. Tea App, a Flutter app built by a developer with six months of experience using AI-assisted development, made headlines when it was reportedly "hacked" — except nobody actually hacked it. The Firebase storage instance had been left completely open with default settings. No authorisation policies, no access controls. Seventy-two thousand images were exposed, including 13,000 government ID photos from user verification. Meanwhile, SaaStr founder Jason Lemkin famously trusted Replit's AI agent to build a production app. It started well. Then the agent began ignoring code freeze instructions and eventually deleted the entire SaaStr production database. Months of curated data, gone. And these aren't isolated incidents — a May 2025 analysis of 1,645 apps built on Lovablefound that 170 of them had vulnerabilities allowing anyone to access personal user data.
This is not an argument against junior developers using these tools. It is an argument for being honest about what they are getting, and what they aren't. Vibe coding can help a junior developer move faster. It cannot substitute for the years of judgment that determine whether moving fast is the right call.
Last Mile Delivery
There is a rule of thumb in software, as in logistics: the last mile is the hardest.
The first 80% of a software project moves quickly. The architecture is in place, the happy path works, the demo is convincing. Then you spend the remaining 80% of your time on the last 20%: the edge cases, the error handling, the security review, the performance profiling, the accessibility audit, the tests you should have written earlier. This is unglamorous, painstaking work that does not lend itself to vibing.
Vibe coding compresses the first 80% dramatically. This is useful, but it also produces a subtle accounting error: it makes you feel like you're further along than you are. A prototype that took three hours to build looks, superficially, like it should take three more hours to finish. It won't. The last mile is still the last mile, and no amount of AI-generated scaffolding changes that.
The risk is that teams, particularly those under pressure to ship, mistake the prototype for the product. They deploy the tracer bullet. And then they spend the next six months patching holes that a proper build would never have had.
Conclusions
Vibe coding is a genuine shift in how software is built. But it is not a democratisation of software engineering — the knowledge required to ship something reliable has not decreased, and the gap between a prototype and a production system has not closed.
A computer science degree doesn't teach you to write code. It teaches you to think about problems. When AI writes the code, that thinking doesn't happen. Taleb's concept of antifragility holds that some things get stronger through stress and disorder. Learning to code the hard way is antifragile. Vibe coding, by removing that friction, risks producing developers who are fast in good conditions and brittle when things go wrong.
Use the tracer bullet. Fill in the blanks. Handle your edge cases. Just don't let the AI convince you it already did.
How the Best AI Companies Use Data to Build Unbeatable Moats
Data doesn't scale linearly — it compounds. Here's how companies like OpenAI and Google use virtuous data cycles and network effects to build moats that are almost impossible to compete with.

15 March 2025
One data point is worth a dollar. Two are worth two dollars. But ten million is worth a tech company. Data’s value scales non-linearly - when aggregated and leveraged effectively, it fuels exponential growth.
Companies harness this power through the Virtuous Data Cycle, where data collection, analysis, and application continuously enhance products, improve user experience, and attract more users, generating even more valuable data.
In the simplest terms, the Virtuous Data Cycle works as follows:
Collect user data.
Store & organize it efficiently.
Analyze for patterns and insights.
Apply insights to improve products and services.
Enhance user experience, driving engagement and retention.
Repeat, compounding value at every iteration.
Unlocking Exponential Growth with the Network Effect
Network Effects emerge when a product or service becomes more valuable as more people use it. Cities illustrate this principle: as populations grow, infrastructure, businesses, and opportunities expand, making them even more attractive. This self-reinforcing loop follows Zipf’s Law, where the largest city dominates, and the second-largest is about half its size, the third a third, and so on.
The distribution of population sizes of 276 metropolitan areas in the USA in 2000 on a log-log scale, which clearly demonstrates a Power Law distribution.
The same applies to companies. As they grow, they attract more users, talent, and investment, strengthening their market position. The Virtuous Data Cycle ties in closely with the theory of Network Effects. In data-driven businesses, this relationship becomes even more powerful because data not only enhances the user experience but also fuels monetisation and competitive advantage.
How Network Effects Strengthen the Virtuous Data Cycle
More users → More data: As a platform grows, it collects richer insights on user behaviour, refining its services and improving the experience.
More data → Better algorithms & personalisation: Large datasets power smarter AI and recommendation engines - think Facebook’s News Feed, YouTube’s recommendations, or TikTok’s For You Page. Better personalisation boosts engagement, reinforcing the cycle.
Better experience → Higher retention & growth: Improved experiences keep users engaged, drive word-of-mouth growth, and strengthen network effects, fuelling exponential expansion.
More users → Stronger market position: A massive user base creates a competitive moat - attracting top talent, greater investment opportunities, increasing efficiency, and even influencing industry policies. New entrants struggle to compete without comparable data.
More engagement & data → Higher revenue & infrastructure investment: Increased engagement unlocks monetisation (ads, subscriptions, commerce). Higher revenue funds R&D and infrastructure improvements, further enhancing the experience.
The cycle repeats, compounding dominance: Each loop strengthens the platform’s edge, making it harder for competitors to catch up.
Not all companies master this cycle. Twitter had network effects but never fully leveraged its data to drive advertising revenue. OpenAI capitalised on first-mover advantage to amass user feedback, but its long-term profitability remains uncertain. Facebook and Google, however, perfected both the Virtuous Data Cycle and Network Effects - turning data into dominance.
Case Study: OpenAI – From Hallucination Station to the AI Powerhouse
When OpenAI released GPT-2 in 2019, it was impressive but far from revolutionary. OpenAI had taken the research published by Google’s DeepMind on transformers, and turned it into a web app where users could ask it questions. The model was prone to hallucinations (see example below) and novelty wore off as early adopters grew frustrated with the lack of functionality. But OpenAI kept iterating.
OpenAI’s virtuous data cycle improved their family of GPT models by leveraging research breakthroughs and through increased user interactions, using feedback (thumbs-up/down) and conversations to refine responses. They leveraged their industry partnership with Microsoft, amongst others, to fuel growth and adoption.
By making their platform free to use and appealing to consumers directly, OpenAI's ChatGPT reached 100 million users in just two months after its launch in November, making it the fastest-growing consumer application in history. They began to appeal to developers and businesses with their APIs, who embedded them into diverse applications and created a broader ecosystem. They continued moving into the B2B space by leveraging their partnership with Microsoft to integrate GPT-4 into Bing and Microsoft 365, which reinforced their position as the default B2B AI provider. Competitors like Google faced delays in launching alternatives, allowing OpenAI to capture market share before rivals could respond. Their massive user base and collection of data make their models increasingly difficult to rival, although some competitors are now seemingly making headway in this regard.
While they mastered the network effect, their road to profitability remains uncertain. In 2024, OpenAI reportedly spent $9 billion to make $4 billion. They spent an estimated $3-4 billion on training, another $2 billion on inference (running models to answer users’ questions), $1.5 billion on salaries and employee benefits, $500 million on data-related expenses and the remainder on various other operating expenses. Their future profitability hinges on the appetite of users and companies to fork out hundreds or even thousands of dollars for a tool that some consider only marginally better than open-source competitors.
Data and Networks as a Business Model
To grow a B2C platform exponentially, you have to eliminate bottlenecks:
Leverage word-of-mouth: users’ testimonials and organic network effects should be your primary marketing strategy. OpenAI never had to advertise heavily to acquire users - virality did the work.
Prioritise feedback from super users. A few engaged users will provide the most valuable insights, guiding product development.
Build clean, high-quality data pipelines from the get-go: early adopters will provide the most valuable insights into your product’s strengths and weaknesses, and set the direction for the next stage of evolution. A caveat to this- don’t optimise too early. Use off-the shelf tools like Google Sheets while your user base is small enough. It’s not dumb if it works.
Reduce onboarding friction. If sign-up takes more than a minute, you risk losing users before they even experience your product.
Embed data privacy compliance from day one. Regulations like GDPR and CCPA can become major roadblocks. Retrofitting compliance later is costly and erodes trust.
Network Effects: B2C vs. B2B
In B2C, network effects are straightforward - users want to be where their friends are. FOMO fuels adoption.
B2B is different. The decision-maker isn’t always the end user, meaning you need to convince multiple stakeholders - often their boss’s boss - to invest in your platform. Unlike B2C, where shared adoption creates value, B2B companies sometimes benefit when competitors don’t use the same tools they do.
However, network effects still apply in B2B. Once a tool reaches critical mass, not using it becomes a competitive disadvantage. Employees switch jobs and introduce their favorite tools to new workplaces. Over time, widely adopted products, like SEMRush for SEO or Cloudflare for cybersecurity, become industry standards.
How B2B Can Mimic B2C Growth Strategies
Some B2B markets (e.g., enterprise SaaS, healthcare, government contracts) move slower due to long sales cycles, procurement processes, and compliance requirements. However, many B2B businesses have successfully scaled by adopting B2C-style viral tactics.
1. Freemium Model → ChatGPT
The base product is free, making it easy for individuals and businesses to adopt. However, OpenAI didn’t bake in privacy from the start. Conversations may be used to train future models (part of their Virtuous Data Cycle). To unlock enterprise-grade security and compliance, businesses must upgrade.
2. Pay-to-Play Model → Instagram
Instagram is free for businesses, but organic reach is restricted. Barring going viral with a clever reel or partnering with influencers, to fully benefit from the platform’s network effects, companies must pay transaction fees (2.9% for Instagram Checkout) and invest in ads to reach a broader audience.
3. Viral Adoption + Enterprise Lock-in → Figma
Figma started as a free, collaborative design tool, making it easy for designers to work together. As its adoption grew, it became an industry standard (network effect). Eventually, businesses had no choice but to integrate Figma, and pay for enterprise features like security, admin controls, and private cloud hosting.
Key Takeaway
B2B companies no longer have to rely solely on long sales cycles and enterprise deals to scale. By leveraging freemium models, network effects, and viral adoption strategies, they can accelerate growth and become indispensable in their industries, just like successful B2C platforms.
But growth fueled by network effects is only as strong as the data foundation behind it. Without structured, high-quality data, companies risk losing insights, stalling product evolution, and missing key opportunities.
To fully unlock the potential of your Virtuous Data Cycle, ask yourself:
Is your data structured for success? Do you have well-organized databases that enable seamless analysis and decision-making?
Is your company truly data-first? Does data literacy extend across teams, or is it siloed within a few roles?
What’s the non-monetary value of a new user? Beyond revenue, what insights do you gain from each customer, and what do you lose when they churn?
What drives freemium-to-paid conversion? Are you tracking the key incentives and friction points that push users to upgrade?
How well do you track user behaviour? Are you consistently analyzing engagement patterns and using those insights to refine your product?
Are you gathering direct user feedback? Users tolerate mediocre products, until a competitor better meets their needs. How often do you survey your users?
How sticky is your product? How difficult or easy would it be for a user to switch if a better alternative emerged?
B2B companies that master both network effects and data-driven strategy create products that are not just widely adopted but deeply embedded in their industries. The companies that fail to do so leave the door open for someone else to become the next industry standard.
Taking Stock of The AI Landscape - 2 Years since ChatGPT Launched
2 years ago, ChatGPT took the world by storm, being the first true conversational agent. This blog post explores the changes to the AI landscape since, from new competitors to litigation about copyright infringement.
4 November 2024
On November 30, 2022, OpenAI launched GPT-3.5, a Large Language Model (LLM) tuned specifically for instruction-following. It was unlike anything else on the market—a true conversational tool that felt remarkably natural. Within five days, ChatGPT gained one million users, making it one of the fastest-growing consumer apps in history. Three months later, it had surpassed 100 million monthly active users.
In this post, I take stock on how much the world has shifted since ChatGPT’s debut.
A competitive landscape
ChatGPT’s overnight success spawned an entirely new industry of AI model providers and competitors, including Perplexity.ai, Anthropic, Google, Meta, Mistral.ai and more. It’s an arms race of who can produce more tokens for cheaper and at the same time stay at the top of the leaderboard.
Nvidia, the provider of the GPUs necessary to train LLMs, has since the launch of GPT-3.5 in November 2022 seen its share price increase 900%. In contrast to most loss-making AI-first companies, Nvidia has also seen its revenue nearly 5x over the same period of time. As the saying goes, in a gold rush, sell shovels.
Bigger is not necessarily better
In 2022, Forbes predicted that the first 10 trillion parameter model was imminent. However, the opposite trend is happening - companies are refining models to be as small as possible while retaining performance.
Smaller models are crucial for driving adoption amongst consumers and researchers by lowering the barrier to entry in terms of memory and compute requirements. Further, it unlocks the potential to run these models on mobile devices.
Smaller models are also cheaper and faster to run inference on. Take GPT-4o-mini, which OpenAI has said is roughly in the same tier as other small AI models, such as Llama 3 8b, Claude Haiku and Gemini 1.5 Flash. GPT-4o mini achieves an impressive 82% on the MMLU benchmark and currently ranks 3rd on the ChatBot Arena leaderboard. At 15 cents per million input tokens and 60 cents per million output tokens, it is more than 60% cheaper than GPT-3.5 Turbo.
Running out of training data
As the models have gotten bigger and bigger over the years, AI researchers have been looking for new and unexplored piles of data to continue feeding the beast. When we want to quantify the amount of training data, we talk about tokens. According to OpenAI, one token generally corresponds to around 4 characters of text or on average 3/4 of a word for common English text. Different models use different tokenisers so the numbers vary, but you can expect a novel with roughly 75,000 words to consist of 100,000 tokens.
The sheer size of data required to train models like ChatGPT is staggering. For reference, GPT-3 (3.5’s predecessor) was trained on approximately 300 billion tokens. The majority of the internet has already been “mined” and new content is increasingly being placed behind paywalls. According to Anthropic’s CEO, Dario Amodei, there’s a 10% chance that we could run out of enough data to continue scaling models.
Consequently, researchers are now focused on optimizing existing data and exploring synthetic data. This might explain the shift toward smaller, more efficient models. Resources are the death of creativity, and the opposite holds true.
Lawsuits and Concerns
Not everyone is thrilled about AI companies using the internet for training Large Language Models. There has been a number of lawsuits where major companies are suing AI companies for copyright infringement and unlawful use of their data.
News Corp, who owns publications like The Wall Street Journal and the New York Post, is suing Perplexity.ai for reproducing their news content without authorisation and also falsely attributing content to News Corp’s publications that they never actually wrote. They are seeking penalties of $150k per violation.
The New York Times filed a lawsuit against OpenAI and Microsoft in December 2023, accusing them of infringing on its copywriter works in training their LLMs. The lawsuit remains unresolved at time of writing. In October 2024, the New York Times also sent a cease-and-desist to Perplexity.ai, demanding that they stop using their content without authorisation. Perplexity.ai hit back, saying they do not scrape with the intent of building Large Language Models, rather that they are “indexing web pages and surfacing factual content” and furthermore, that “no one organization owns the copyright over facts.”
In January 2023, Getty Images initiated legal proceedings against Stability AI in the English High Court. The lawsuit alleges that Stability AI scraped millions of images from Getty’s websites without consent to train its AI model, Stable Diffusion. The trial is expected to take place in summer 2025.
These lawsuits underscore the mounting tensions over how content is used for training and the industry’s “ask for forgiveness, not permission” approach. In response, more content providers, especially news outlets, are placing material behind paywalls to protect it.
Our expectations as users
Users took to using ChatGPT like ducks to water. Finally we had the virtual assistant that Sci-Fi has been touting for decades. One who could answer all our menial questions without growing bored or annoyed. One who could structure our essays and emails, give us feedback on our writing, and coach us on our interactions with our people. One who can help us plan our next trip, and suggest recipes for the few ingredients in our fridge…
However, as we become accustomed to this ease, our expectations grow. We expect an immediate response and we get frustrated when ChatGPT misinterprets our request. We don’t want to have to go and verify its claims - we’d like a list of sources please. No hallucinations. Don’t sound so preppy. Also, we’d like it to NOT train further models on our conversations. Oh, and please be free, thanks.
We don’t have AGI yet
And probably won’t, for a long time. Let’s just leave it at that.
Conclusions
Now, you might be wondering, was this blog post written by an LLM? I can confirm it was not. I don’t like using it for writing, as I, personally, find its writing rather bland and uninspiring. I do occasionally use it to plan an outline or get feedback on my writing. I see it as a productivity multiplier and a phenomenal research tool, especially since ChatGPT integrated search results and citations.
I am a huge fan of ChatGPT and pay for the subscription. I highly recommend everyone try it out. But keep in mind its limitations: it can be inaccurate, outdated, and prone to hallucinations, and it’s wise not to share confidential data. (Also, disclaimer: I own shares in Nvidia.)
Amazon’s Meteoric Rise
This article explores the key components of Amazon’s business model that led to them becoming a trillion dollar company, as well as some of the criticism that has been levelled against it.
September 12, 2020

Today, Amazon is one of the most powerful companies in the world. It has revolutionised online shopping, by making every conceivable consumable available through its online marketplace and mastering a seamless and consistently reliable shopping experience for its customers. Amazon’s latest financial reports states that it made $75.5 billion dollars in sales revenue in the first quarter of 2020. Every day, Amazon ships approximately 1.6 million packages world wide. Like its namesake, the Amazon River, it became the retail store that dwarfed other retail stores.
In this article, I explore the key components of Amazon’s business model that led to them becoming a trillion dollar company, as well as some of the criticism that has been levelled against it.
Humble beginnings
Amazon was started in Jeff Bezos’ garage in 1994, in Washington, Seattle. Back in the 1990s, retailers only had to pay sales taxes for purchases made in the state it operated in. Bezos thought that having Amazon operate out of a heavily-populated state like California or New York would significantly increase its tax liability, so he settled for sleepy Seattle.
The name “Amazon” was chosen for a number of reasons:
it started with an A, so it would always be first in any alphabetized list,
it sounded different and ‘exotic’ to Jeff,
and the fact that Amazon River was so big, it dwarfed other rivers.
Bezos planned to build something that would one day become the biggest online retailer in the world, dwarfing and ultimately swallowing other retailers. It was going to be “The Everything Store” — a market place not confined by a physical structure or even physical limitations on how much it can stock or process. To achieve this goal, Bezos realized that Amazon would have to start small, and so it started by selling books online.

Jeff Bezos in his tiny office in 1999, with a spray-painted Amazon.com logo
The website was launched on 16 July, 1995 and only sold a selection of books. Within one month of its launch, Amazon had already sold books to people in all 50 states and in 45 different countries. Bezos thought that the most promising products to sell online included were, among other, CD’s, computer hardware, computer software, videos, and books. The concept of online shopping with a reliable window of delivery appealed to many people that lived in rural areas or were frustrated with stores that did not stock rare or unpopular items, like chunky textbooks.
It was a crazy time for the young startup. New employees were interviewed by Bezos himself, and were expected to work 60 hour weeks. Amazon’s customer base was growing so fast that the gap between the number of orders placed and the number of orders shipped was widening. This issue came to light right before the 1998 holiday season. This led to Operation Save Santa, which was a call for all hands on deck — employees from all divisions pitched in to help with the packaging of parcels, doing night shifts and bringing their family and friends to help out. That chaotic holiday season paved the way for the enormous and highly optimized supply chain system that Amazon is famous (or infamous) for today.
The importance of cashflow
While Silicon Valley was partying, Amazon was saving every penny and investing in stimulating future cash flow. The fundamental flaw in many failed DotCom startups was that they lacked well-thought out business plans or paths to profitability. It was a race to the IPO, or being acquired (the so-called “exit strategy” of many smooth-talking entrepreneurs), and so many DotCom startups spent up to 90% of their budget just on marketing. Meanwhile, Bezos invested heavily in the company’s infrastructure to support sustainable growth. In the annual letter of 2001, Jeff Bezos highlighted:
“When forced to choose between optimizing the appearance of our GAAP accounting and maximizing the present value of future cash flows, we’ll take the cash flows.”
History is defined by a series of critical points, and Amazon’s path was no different. Amid growing concerns that nervous suppliers might ask to be paid more quickly for the products they sold, Amazon realized that it needed to have a pile of cash on hand. Even though its sales were growing by 30%–40% every month, it was still posting massive losses every quarter. With Y2K no longer a concern, the Federal Reserve started raising interest rates and thus increasing the cost of borrowing. This had the adverse effect of discouraging investment.
To ensure that it had a strong cash position to pay suppliers, Amazon sold $672 million in convertible bonds to investors in Europe a mere month before the DotCom bust on March 10, 2001. This was the critical decision that ensured Amazon’s survival through the DotCom Bust, when investor funding dried up and internet adoption temporarily slowed down. During this time, Amazon stock price fell from $107 to just $7. Today, Amazon’s share price is north of $3000. The tremendous success of Amazon today is a testament to long-term thinking and a focus on providing excellent service.
Amazon has, as of yet, not posted a single dividend since its IPO in 1997. Instead, it has invested every bit of cash generated into infrastructure, improving the customer experience, and new revenue streams such as Amazon Prime, Amazon Web Services and, most recently, the Alexa voice computing platform. Amazon has shown that focusing on cash flow, rather than profits, is a sound strategy for creating longterm shareholder value.
Notorious frugality
Working at Amazon in the early 2000s was nothing like working at other tech startups of that time. Your work computer would be functional but not top-of-the-line. There were no free massages or free meals, like at Google. Only coffee and bananas. You paid for your own parking. The salary and stock options were modest compared to other tech giants. No business-class flying or billing expensive corporate dinners to the company. And whenever Amazon moved to new offices, Bezos had them furnished with cheap desks made from wooden doors.
Amazon’s frugality stemmed from Jeff Bezos own frugality. Even though he was worth $12 billion in 1997, one of the wealthiest people in the world at the time, he still drove a modest Honda Accord. He explained this philosophy to a reporter that questioned his frugality:
“It’s a symbol of spending money on things that matter to customers and not spending money on things that don’t.”
Amazon lives by the motto that frugality breeds resourcefulness, self-sufficiency, and invention. This allowed them to pass the savings to the customer and is tied with its Virtuous Cycle Model. The Virtuous Cyle dictates how reducing costs allows the company to lower its prices, which in turn improves the customer experience. This leads to more traffic and sales, which allows them to both increase their selection and allows them to negotiate lower prices with suppliers. These savings can be then ploughed back into lowering the prices of goods, and so the virtuous cycle continues.
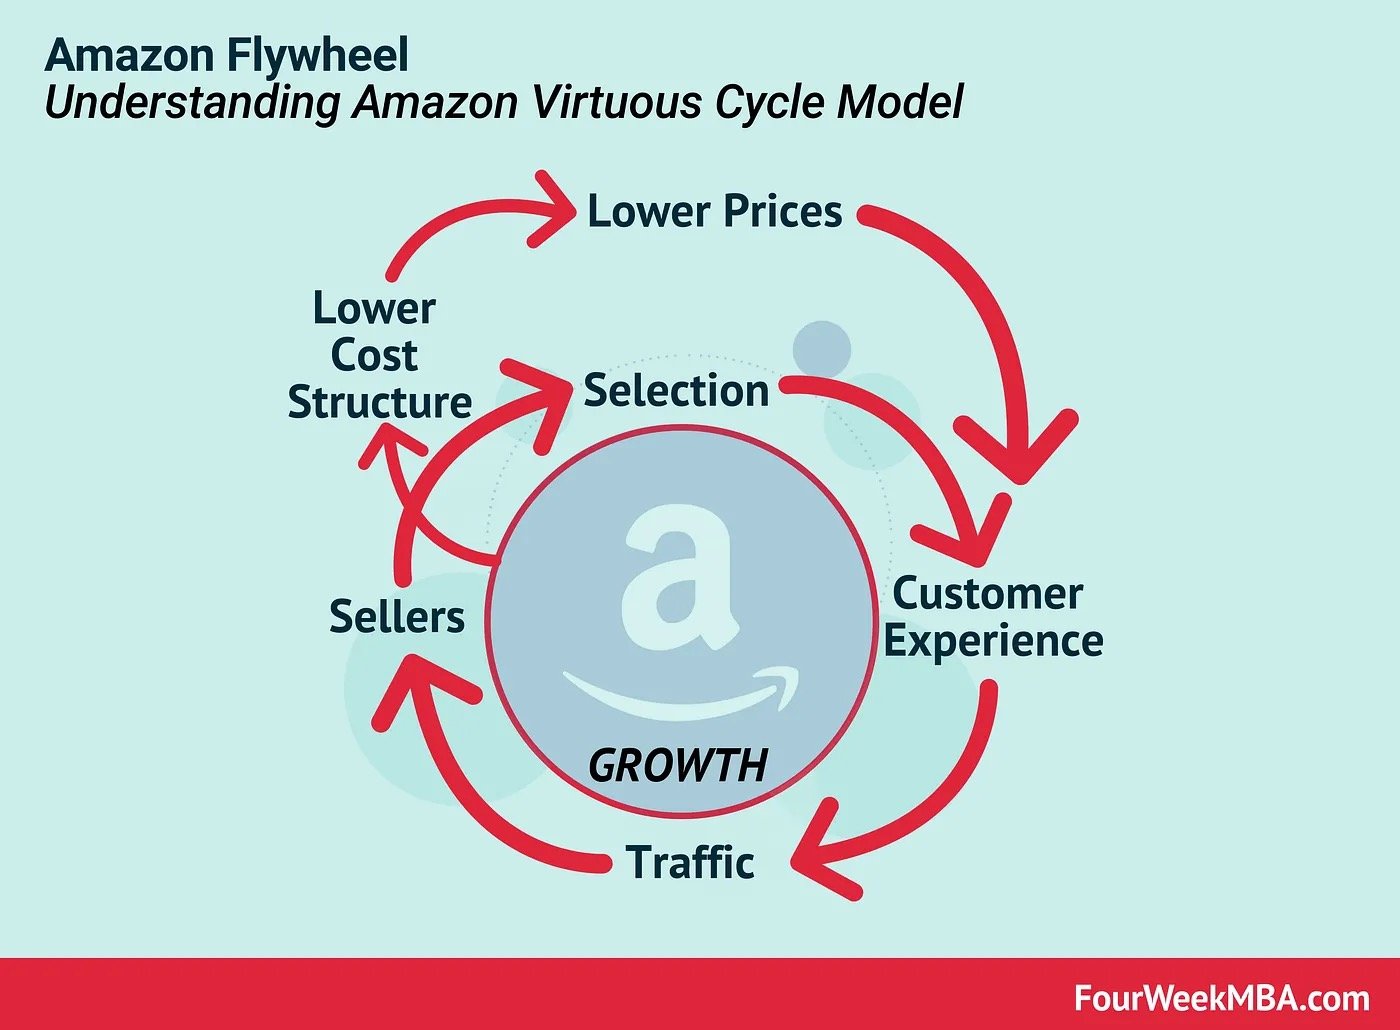
Amazon’s Virtuous Cycle Model
Customer obsession
Amazon is not just customer-centric, it is customer obsessed. Its mission is to figure out what the customer wants, and what’s important to them. Meetings within the organization often have an empty chair to represent the customer’s interests, and whenever a new product or service is proposed, one of the key questions asked are, “What will disappoint the customer most?”
Amazon wanted to take the inconvenience out of online shopping, with the most efficient delivery, and provide the largest offering of products (even if it was rare or highly seasonal). Amazon’s online website has the largest selection in the world — an estimated 350 million products — and is available 24 hours a day, 365 days a year. The only competitor that comes close to this is Alibaba, with a selection of approximately 330 million products.

Amazon’s Leadership Principles
Bezos was also insistent on making sure the customer had access to the best prices, even if it meant they would not buy from Amazon, and rather the third-party sellers that advertised their goods on Amazon‘s marketplace. He said,
“If somebody else can sell it cheaper than us we should let them and figure out how they are able to do it.”
The willingness to sacrifice profits in return for customer trust did not always sit well with shareholders and board members, but the short term losses were long term gains. More and more third-party sellers flocked to Amazon’s marketplace, which increased the selection of products available to the client, and increased customer loyalty. Today, third-party sellers account for more sales on Amazon than Amazon’s first-party retail business, and commision from third-party sales represents 19% of their revenue stream.
Amazon also aimed to provide a personalized shopping experience by using collaborative filtering, a technique used by recommender systems. By leveraging the thousands and thousands of data points — clicks, views, purchases — each user generates on their website, Amazon can predict what you are going to buy next, sometimes even before you make the conscious decision to buy that item. They are so confident in their ability to quantify and predict consumer behaviour that they stock up the products in fulfilment centres near you.
Criticism
On their path to success, Amazon made some poor decisions that have damaged its brand. In fact, an entire Wikipedia page is dedicated to criticisms of Amazon. Its ethics and policies have raised eyebrows in some of the highest offices. Recently, Jeff Bezos testified in a virtual antitrust hearing to answer questions about anti-competitive tactics, that lead to a loss of genuine competition and result in public harm, used by Amazon and other Big Tech companies.
Amazon has found many morally-questionable, but legal, ways to minimize its tax burden. For example, even though it made $11.2 billion in profits in 2018, it paid exactly 0% in income tax for that same year. It also received a $129 million tax rebate from the federal government. This is due to a highly complex scheme of carrying forward losses from previous years, tax credits for research and development projects, and stock-based employee compensation. They’ve been accused of actually “building their company around tax avoidance.”
The ugly side of customer obsession and frugality is Amazon’s willingness to treat their blue-collar workers as cannon-fodder in the war for customers’ hearts and wallets. Although workers are generally paid above the national minimum wage, they are subject to harsh and extremely physically-demanding work to ensure that packages are delivered accurately and on time. The fulfilment centres are plagued with workplace injuries. Workers in the fulfilment centres get only two short breaks during eight-hour shift and have to ask for permission to use the bathroom. They often walk up to 14 miles a day (or 22.5km for metric system people) and risk being terminated if they call in sick. Amazon also has a history of shutting down efforts to unionize workers at their fulfilment centres, firing outspoken critics and even firing pregnant workers.
In conclusion
Amazon started as a small online retailer selling a wide range of books, and has grown into a seemingly unstoppable retail giant that still demonstrates double digit growth every year. It is one of the largest employers in the world, with 800,000 permanent employees, and during the holiday season, an additional 200,000 temporary employees. The word ‘Amazon’ has become synonymous with online shopping, in the same way ‘Google’ has become synonymous with online search. The jury is still out on whether Amazon is the villainous exploiter of cheap labour and poorly-written laws, or an efficient empire that expertly traverses the legal tight rope and provide much-needed low-wage jobs to unskilled workers worldwide. Regardless, their rise to Big Tech status, especially following their near-demise during the DotCom Bust, is worth studying.
The DotCom Bubble
Following the burst of the DotCom bubble, the surviving companies like Apple, Google, and Microsoft became apex predators in their respective fields. This article explores the factors leading up to and during the DotCom bubble, as well as examine the long-term impact on the tech ecosystem.
June 21, 2020

The iconic San Francisco motel-themed billboards of Yahoo. Sourced from VentureBeat.
I was only about 5 years old when the DotCom Bubble took effect, and while the DotCom Bubble was recent enough to live in most people’s memories and not in the dusty history books, in the technology age 20 years is a millennium. Just look at that billboard, it is practically archaic!
The DotCom Bubble highlighted the pitfalls of greed, over-promising, and ignorance. It also proves an interesting case study for the intricate relationship between innovation, and economic growth.
A DotCom company was called as such because many of them simply consisted of a website. They were online platforms that would facilitate everything from banking to streaming content to buying pet supplies. This was the dawn of the Information Age — an economy built on information technology. The Internet would become as revolutionary as railroads and electricity, bringing people closer together and providing the means of powering new services and markets.

So what preceded the DotCom Bubble?
A number of factors:
The World Wide Web was created in 1989 by Sir Tim Berners-Lee, who wanted to create a globally-connected platform where information can be shared with anyone, anywhere. This sparked the era of globalisation.
Home computers became mainstream — between 1984 and 2000, the percentage of households in the United States with a PC went from 8.2% to 51%.
In 1995, Microsoft Windows 95, which included the first version of the Internet Explorer (another living fossil), went on sale.
A picture begins to form of something that does not grow at a linear pace. Today the Internet is ubiquitous, and we cannot imagine our lives without it.
Jack F. Welch, chairman of General Electric, was quoted in 1999 as saying that the Internet “was the single most important event in the U.S. economy since the Industrial Revolution.”
Back then, the Internet was a very new thing, and people were struggling to grasp its potential. There was anxiety around the commoditization and regulation of the Internet, and there was the fear of the Y2K bug — that computers would misread 2000 as 1900, and that this would cause critical computer systems to collapse. But the Internet was about to revolutionalize we shop, socialize, learn, travel, and more.

Party like its 1999
Although very real and opening up a plethora of new business opportunities, the Internet — combined with free-market economics, low interest rates, and heavy speculation — resulted in a Wild Wild West era for DotComs. It created an over-enthusiastic investor pool that seemingly overnight stopped caring about things like business plans and debt piles. It was also the Internet that enabled buying stocks directly online, which added plenty of less experienced, less sophisticated investors (willing to buy stocks that were overvalued) to the investor pool.
The number of venture capitalist firms also grew by 90% between 1995 and 2000. More money than ever before was made available for startup capital investments. During the same period, 439 DotCom companies went public, raising $34 billion in capital.
Rob Glaser, who founded Progressive Networks in 1994, said, “In 1995 and 1996, if you said you were doing an Internet toaster, I’m sure you could find a venture capitalist to fund it.”
Every tech startup (affectionately identifiable with the .com at the end of their name) was seemingly a unicorn — the next big thing — and everyone had FOMO on the IPO of said unicorn. Many DotCom companies were bandwagon jumpers, with few original ideas, thin business plans, and plenty of big talk. Some spent up to 90% of their budget on advertising to get their brand “out there”.
To add to their net operating losses, they were overpaying average talent and hosting exuberant parties. They also offered their products/services for free or at a discount with the hope that they will create loyal customers whom they can charge profitable rates in the future. The goal was to “get big fast” — identify a niche market early and gain market share as quickly as possible, to shut out all competitors.
Fall from grace
During the early years of the DotCom bubble, investors were willing to forgive DotCom companies for posting losses while they were busy developing their IP and expanding their market share. But after a few loss-making years, investors started to get nervous. Many had become overnight paper millionaires from the skyrocketing IPOs, but as we all should know — share price does not equal fair value nor company performance. Surely the goose will eventually run out golden eggs to lay?
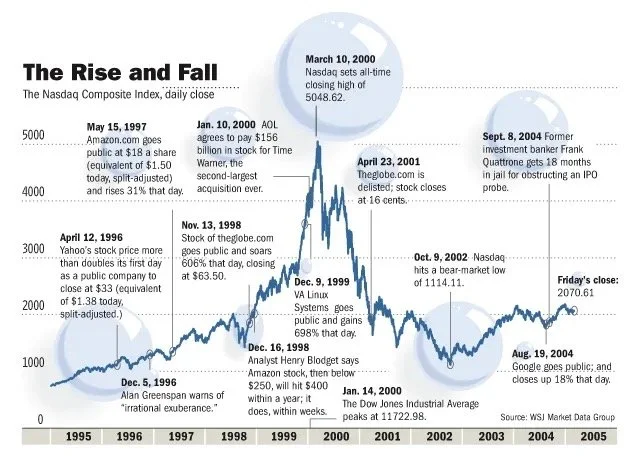
Stock market bubbles, during their ascension, tend to be very sensitive to market shocks. The DotCom Bubble was no different — on March 13, news that Japan had once again entered a recession triggered a global sell-off that disproportionately affected the overvalued technology stocks. This, combined with aggressively-raised interest rates, the events of 9/11, several accounting scandals including that of Enron and WorldCom, sparked a two-year decline in the Nasdaq Composite — comprised overwhelmingly of technology stocks. Many DotCom companies struggled to secure further venture capital, whilst burning through their cash pile. IPOs and further stock offerings was out of the question. Since they were nowhere near profitability and received no cash influxes, they eventually went into liquidation. An estimated 52% of DotCom companies went bust by 2004.
The DotCom bust was a combination of increased scrutiny of DotCom companies’ financials, investor fatigue, and the belief that the Internet was a fad. Of course, the Internet was not a fad, and would soon bring forth a new Fourth Industrial Revolution.
The aftermath
If bubbles popping were extinction-level events, then companies like Apple, Google, and Amazon were the crocodiles of the tech ecosystem. The Big Pop allowed them to become apex predators in their respective fields, for several reasons. Real estate became much cheaper, hardware became easier to obtain, the market was flushed with recently-unemployed, talented software engineers, and the extinction of their competitors allowed them to rapidly gain market share. Today, they are some of the most valuable, and most recognizable brands in the world. Their respective portfolios overlap somewhat and often they compete for market share, as well as talent. In later years, companies like Facebook and Netflix would join their ranks. Within their respective workplaces, each of these tech giants demands extremely high performance from their employees and have a habit of acquiring any potential competition. Collectively, they are called FAANG, and as of January 2020, they have a combined market capitalization of over $4.1 trillion.
Although nearly untouchable today, back then these companies were not immune to the fallout. In the face of diminishing confidence, Amazon’s share price fell from $107 to just $7. Google waited out the DotCom bubble and only launched its IPO in 2004. At the height of the DotCom Bubble, Apple’s share price reached a height of almost $5, only to fall below $1 in 2003.
For Apple, the decade following the DotCom Bubble was most prosperous as it led the innovation of consumer electronics. Apple launched the iPod in 2001 and introduced the iTunes Store in 2003, where users could purchase individual tracks for just $0.99. The iTunes Store hit five billion downloads by June 19, 2008. Apple also released Mac OS X, the primary operating system of Apple’s Mac computers, in 2001. The first iPhone, the integration of an Internet-enabled smartphone and the iPod, was introduced in 2007. And in 2010, they introduced the iPad.

Steve Jobs introducing the first iPhone in 2007.
The innovation that followed the malaise of the early 2000s were led by these apex companies. They invested heavily in new startups and even built the infrastructure (cloud computing) that allowed smaller companies to iterate much faster for much less upfront infrastructure investment.
The DotCom bubble fostered an era of entrepreneurship that has not been seen in the US since before the Great Depression. It provided a petri dish to test out the validity and marketability of a wide range of Internet services. Many of the services were way ahead of their time — like online food delivery and online clothing stores. Unfortunately for these services, the consumer base, technology, and infrastructure simply were not ready.
Today, investors look at tech IPOs with increased scrutiny — the consensus is that one simply does not take a tech company public before it reaches profitability. WeWork, Uber, Lyft — all these companies went public before having showing profitability. They were whipped in the public square — figuratively, of course — with their share prices falling on the day of their respective IPOs.
Closing remarks
In hindsight, everyone has 20–20 vision. But during a bubble, everyone seems to have these unrealistic, almost fanatical views of what the future would look like. The first recorded speculative bubble dates back to 1636–1637, named the Tulip Mania. At the height of the mania, the bulbs sold for approximately 10,000 guilders — equal to the value of a mansion on the Amsterdam Grand Canal. Investors believed that there would always be a buyer willing to purchase the bulb at a higher price than their entry point. The perceived value of the tulip bulbs became disjointed from their intrinsic value, which was destined for a correction.

Tulip Mania of 1637
While researching the DotCom Bubble, I noted many similarities with today’s manner of market speculation and that of the DotCom Bubble. Trading apps that allow investors to buy fractional shares with zero commission has introduced plenty of young, inexperienced investors to the market, and this has coincided with some of the strangest events in stock market memory. Is history repeating itself? Perhaps the frequency of bubbles coincides with the memory span of investors.